Telia Smart Connect is also available as an app on both the App Store and Google Play. This means that you can access your switchboard on your mobile devices with just a few taps, making it even more convenient to have full control.


Dashboard
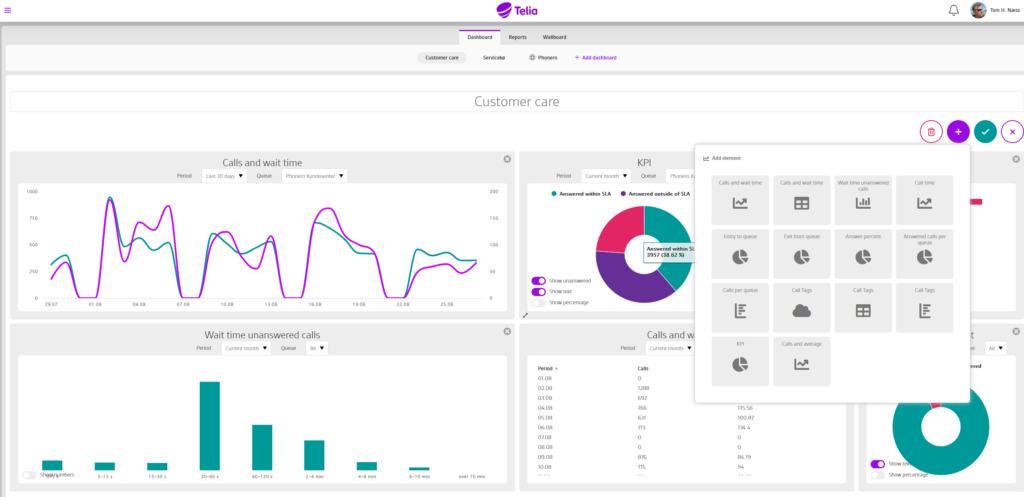
The dashboard is a visual representation of key figures for the statistics module. All users with access to statistics have access to the Dashboard.
Approach
- From the main menu, select “Statistics”
- Select + Add dashboard and name it or select an existing dashboard.
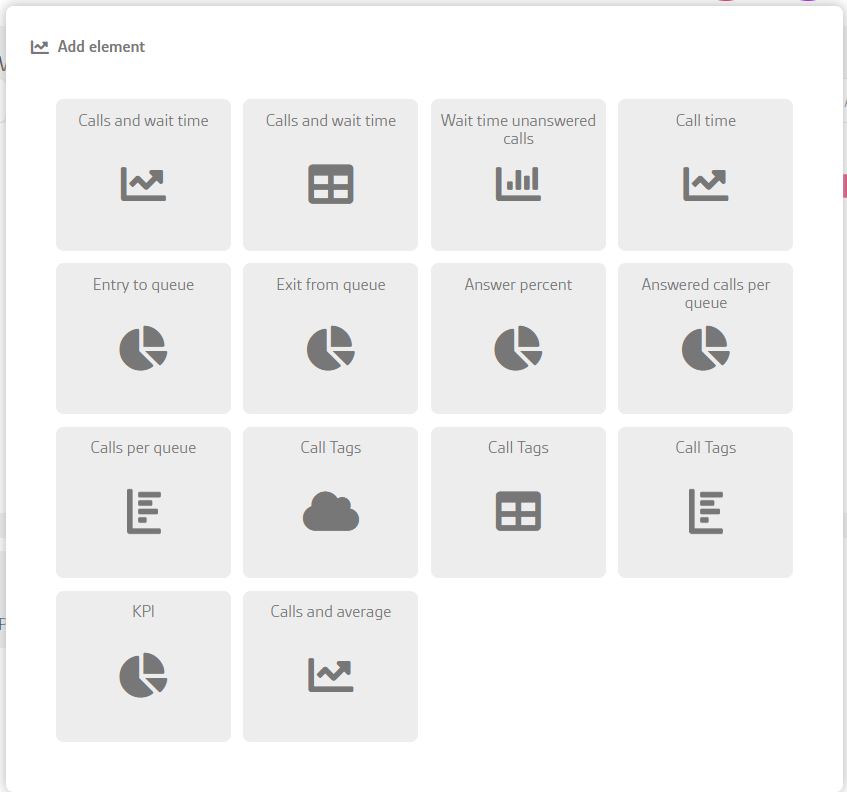
Each user with access to statistics can create their own dashboard. Users with additional access can also create global dashboards that everyone in the company (assuming access to statistics) can see. Click edit, then + to add items to the dashboard. Remember to save when you are done. If you want different periods or queues, it is possible to add the same item several times on the same dashboard. You decide the size of each element, and the elements can easily be moved around by drag-and-drop.
Per element you have two choices:

Choice of queue
You can tick one, several, or all queues.
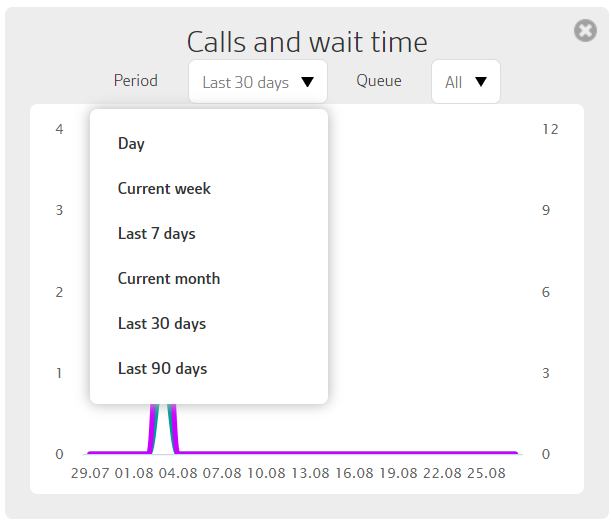
Choice of period
You can choose from predefined periods. Day, Current Week, Last 7 Days, Current Month, Last 30 Days, Last 90 Days, and Current Year. Some of the elements are limited to a shorter period since the call log is used as a data basis, and this can only be stored for 3 months.
The Donut charts also have an additional setting: Show text.
The text descriptions of the Donut diagrams take up a lot of space, so the user can choose whether this should be displayed or not. When editing the dashboard, an on / off switch for “Show text” is displayed.
Dashboard sharing
Each dashboard has its own URL, so that the selected dashboard can be shared with anyone. Those who access the dashboard via this URL will not be able to edit anything. The URL can be changed if it you no longer want someone to have access. Only users with global dashboards can edit or share global dashboards. Click on the share button to create a URL for sharing.
The content is updated with the following frequency:
- Information within the same day: 30 seconds
- Information within 3 months: 30 minutes
- Information beyond 90 days: 1 hour
Wallboard
Set up a wallboard to display information about the current status of the queues. This can for example be displayed on a big screen in your office, to keep everyone up to date on the current status.
Follow these steps to set up a wallboard:
- Click the main menu in the upper left corner.
- Click Statistics.
- Click Wallboard
- Click the plus sign.
- Enter a name for the wallboard
- Select the queues you want to include.
- Click Add.
- Click the newly created wallboard in the list.
- Open the wallboard by selecting the layout. You can choose between these three: Detail views, Index numbers, Detail view and key figures.
You can edit the color by changing the theme of the wallboard. To do this, click the dropdown menu: Theme.
Dashboard elements
Calls and waiting time (graph)
Displays a comparison of calls and latency as a two-line graph: Number of calls and latency (seconds). Grouped differently depending on the selected period
Calls and waiting time (table)
Displays a comparison of calls and latency as a table with three columns: Period (eg day or hour, depending on the period selected), number of calls, and latency (seconds). Grouped differently depending on the selected period
Waiting time missed calls
Bar chart showing waiting time for missed calls for the selected period, grouped by how long they have waited before hanging up.
Call duration
Graph showing call duration per call (average for grouping) for the selected period. Grouping varies depending on the period.
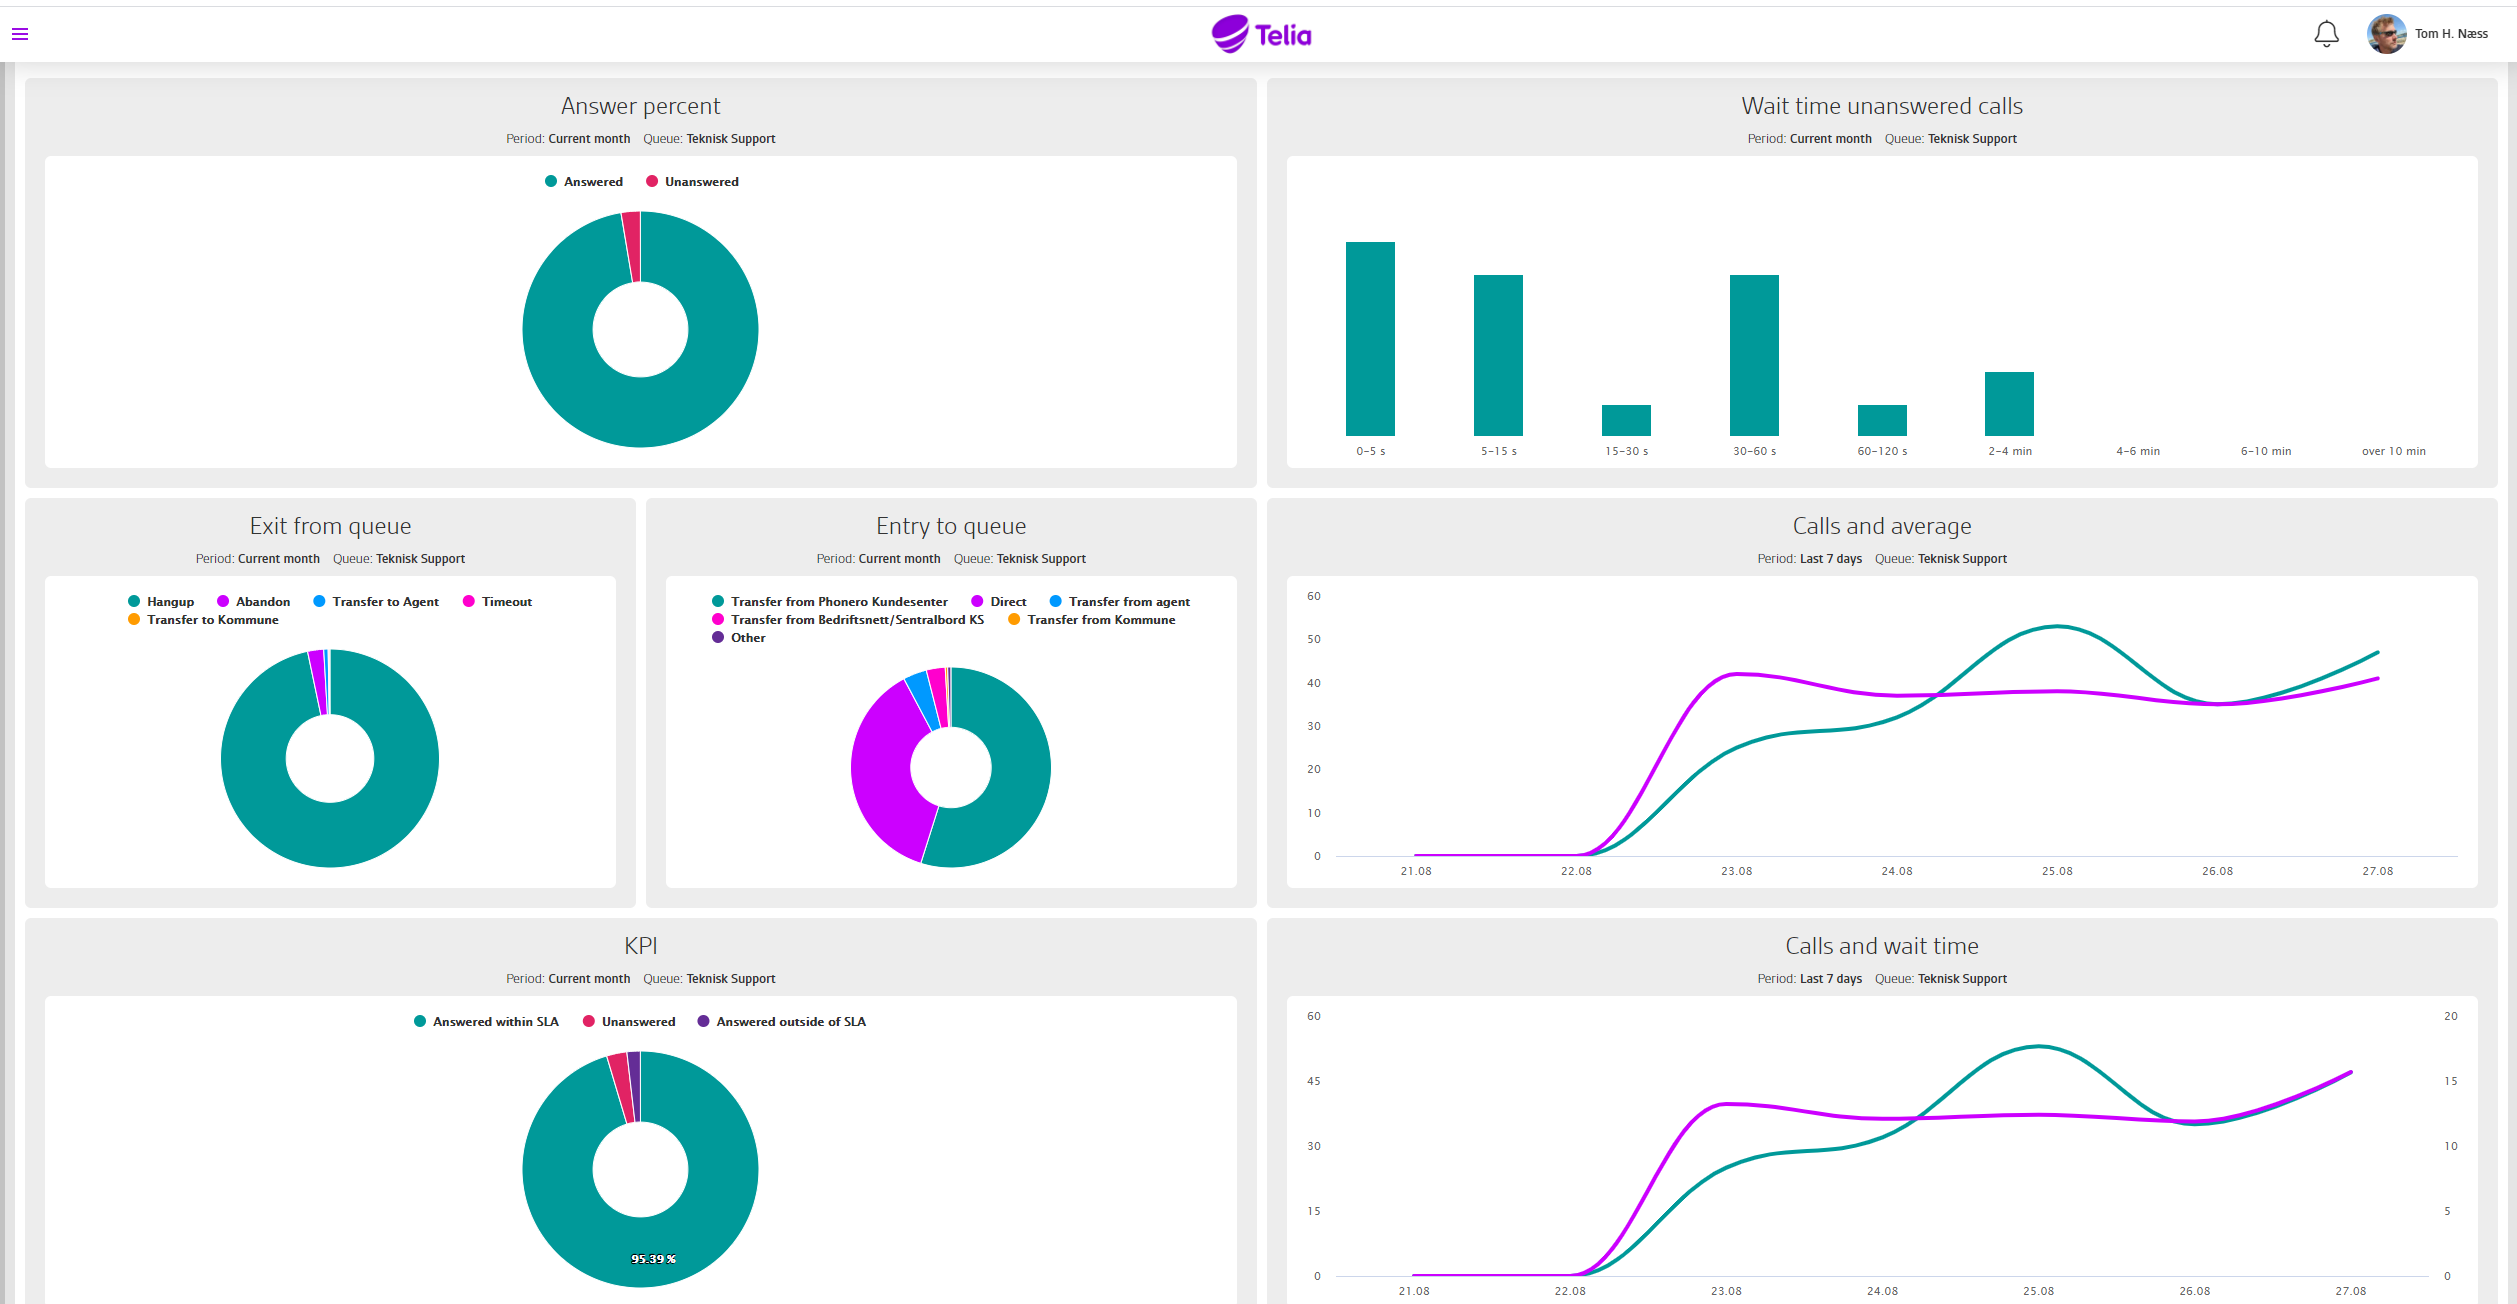
Entrance to queue
Donut chart to tell where a conversation is coming from when it comes to a queue. “Direct” means that the call was dialed directly to this queue
- “Transferred from _ queue name_” means that the caller has first talked to someone in another queue, was also transferred to this one.
- “Transferred from agent” means that the caller has called an agent, also been transferred to this queue.
- “Timeout from _ queue name_” means that the caller has waited in another queue but has not received a response. Then it has moved on to this queue. (Controlled by queue settings and setup in IVR).
Exit from queue
Donut diagram showing where the call has gone after it has been at the selected queue.
- “Ended” means that the caller has spoken to an agent in the selected queue, the call has also been ended.
- “Transferred to _ queue name_” means that the caller has spoken to an agent in the selected queue, also the call has been transferred to another queue.
- “Transferred to agent” means that the caller has spoken to an agent in the selected queue, the call has also been transferred to an agent.
- “Timeout” means that the call has been dialed at the selected queue but has not been answered. The conversation has then moved on to the next step in the IVR (depending on the setup in IVR, they can for example be another queue, callback or voicemail)
Response rate
Donut chart showing the ratio of answered and missed calls for the selected period. Displays percentage and number when holding over the chart.
Answered calls per queue
Donut diagram that shows the relationship between answered calls on the different queues you have selected. Displays percentage and number when holding over the chart.
Calls per queue
Bar chart (landscape) where each selected queue has its bar. Answered and missed calls are displayed one after the other in different colors. Number is displayed when you hold over the column.
Tags (word cloud)
Word cloud that shows which tags are most used for the selected queue and period.
Tags (table)
Same as above but presented as table. Two columns: Tag and number.
Tags (diagram)
Same as above but presented as bar chart (landscape). Two columns: Tag and number.
KPI
Donut chart showing the relationship between calls answered within the CPI, and calls answered outside the CPI. This element also has an additional switch where you can turn on missed calls, so that the element shows the relationship between missed, answered within the CPI, and answered outside the CPI.
Read more about how to set service levels on queues
Number of calls and average
Graph with two lines showing the number of calls for the selected period compared to the average number of calls for the last 12 weeks. An average is calculated for each day of the week, so that traffic from weekends (which is usually lower than weekdays) should not reduce the average. That is, Mondays in the selected period are compared with the last 12-week average for Mondays, and Sundays in the selected period are compared with the last 12-week average for Sundays.
Maximum period for this item is Last 30 days.
User Guides
Here you can find user guides connected to the feature topic. If you can’t find what you are looking for here you might find it in our main user guide archive.
User Guides